Improving Your Dashboard
|
Erin Werra Blogger, Researcher, and Edvocate |
Better dashboards might be the single best way to work smarter in Skyward. It's amazing what a difference it makes when you can get the right information in front of the right people at the right time. Let’s explore tips and tricks to customize different users’ dashboards to maximize efficiency.
Use the quick links to jump between sections:
Qmlativ: Business
SMS 2.0: Business
Qmlativ: Student
SMS 2.0: Student
Qmlativ: Business
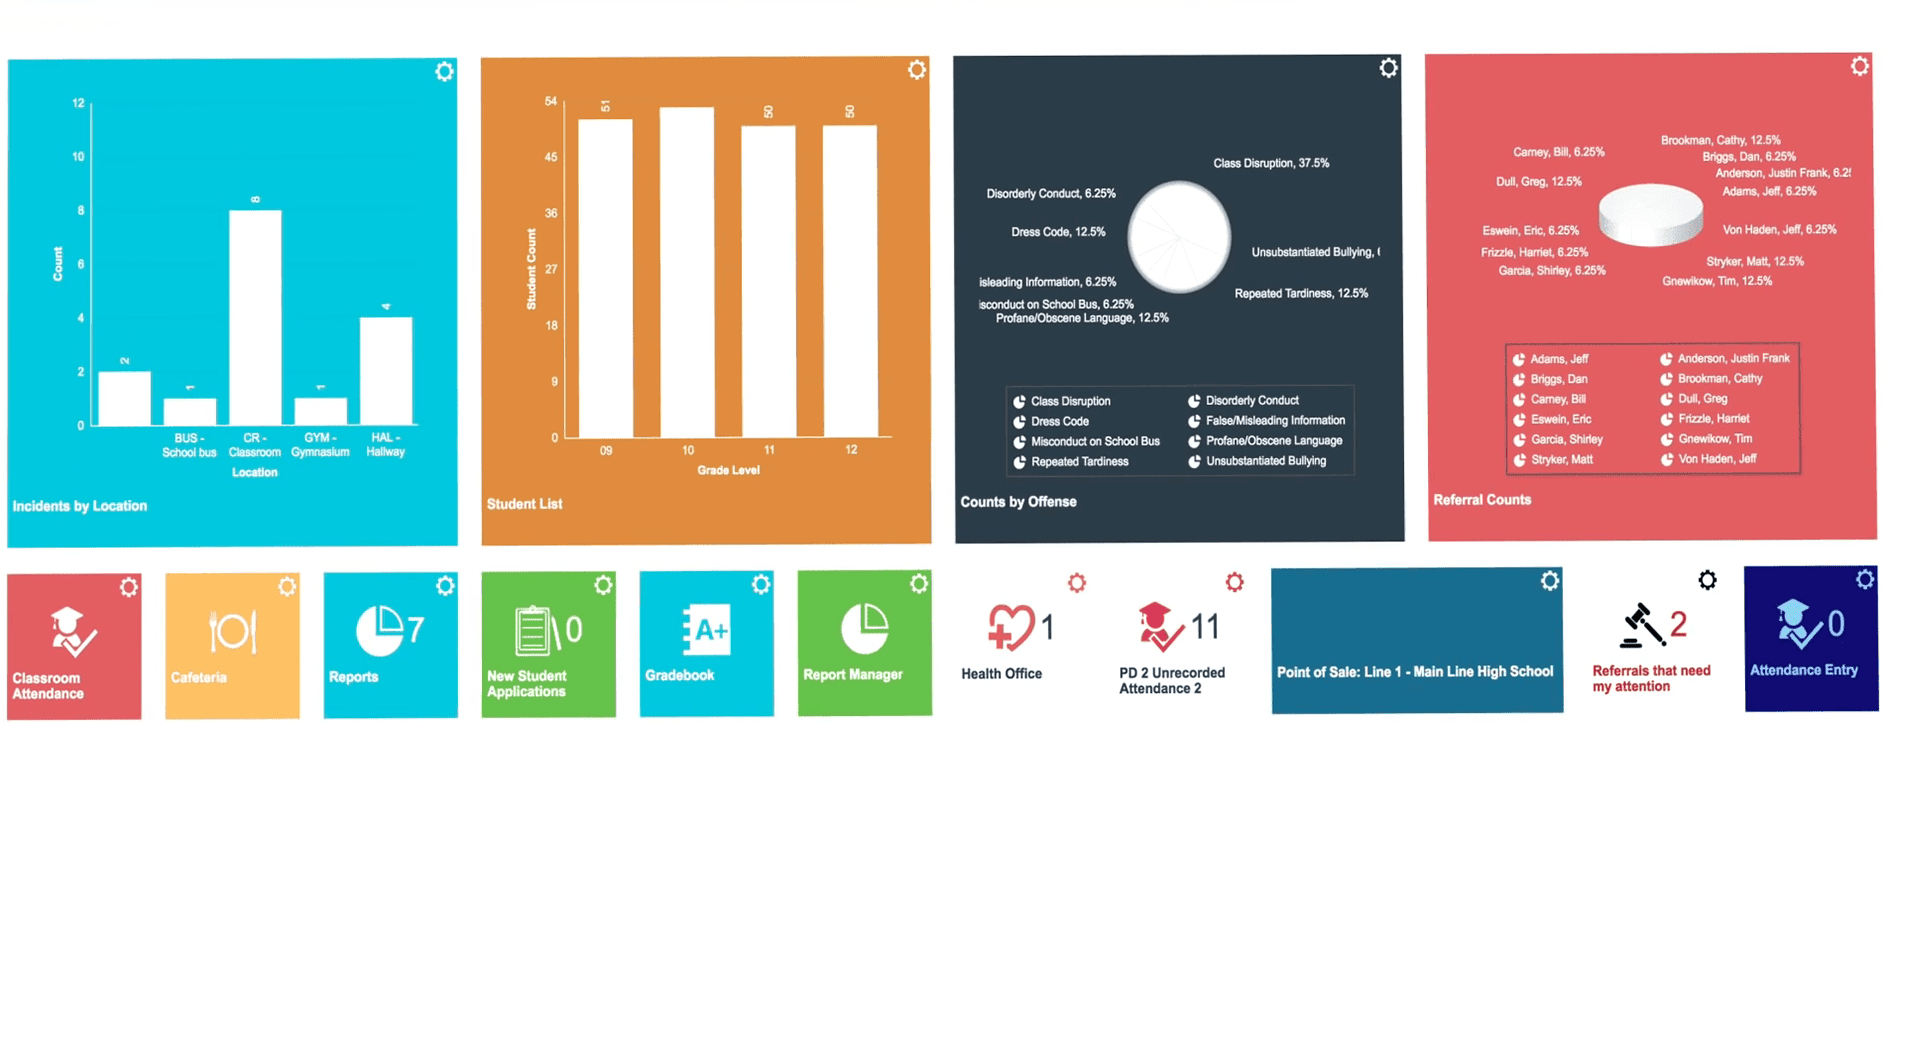
There’s no doubt about it: Dashboards in Qmlativ add a big splash of color. A basic way to customize your dashboard in Qmlativ is to change the names and colors of your tiles. There are three types:
- A favorite tile provides a quick link to a different part of the system where you can complete tasks.
- A live tile provides a quick link, plus notifications and live data directly on the dashboard.
- A chart provides live data from list screens charted directly on the dashboard.

Charts are also a great way to make your dashboard work best for you. Charts offer a huge amount of flexibility—you can create a chart to show real-time results from just about any data points in a list screen. Best of all, the chart setup is in plain language, with an easy phrase to fill in: "I want a(n) [chart] of [x data] grouped by [y data]."
Use the drop-down menus to create the exact chart you want. It’s worth noting that the data points available will be based on security access in the system, but you can chart any list screen you have permission to view.
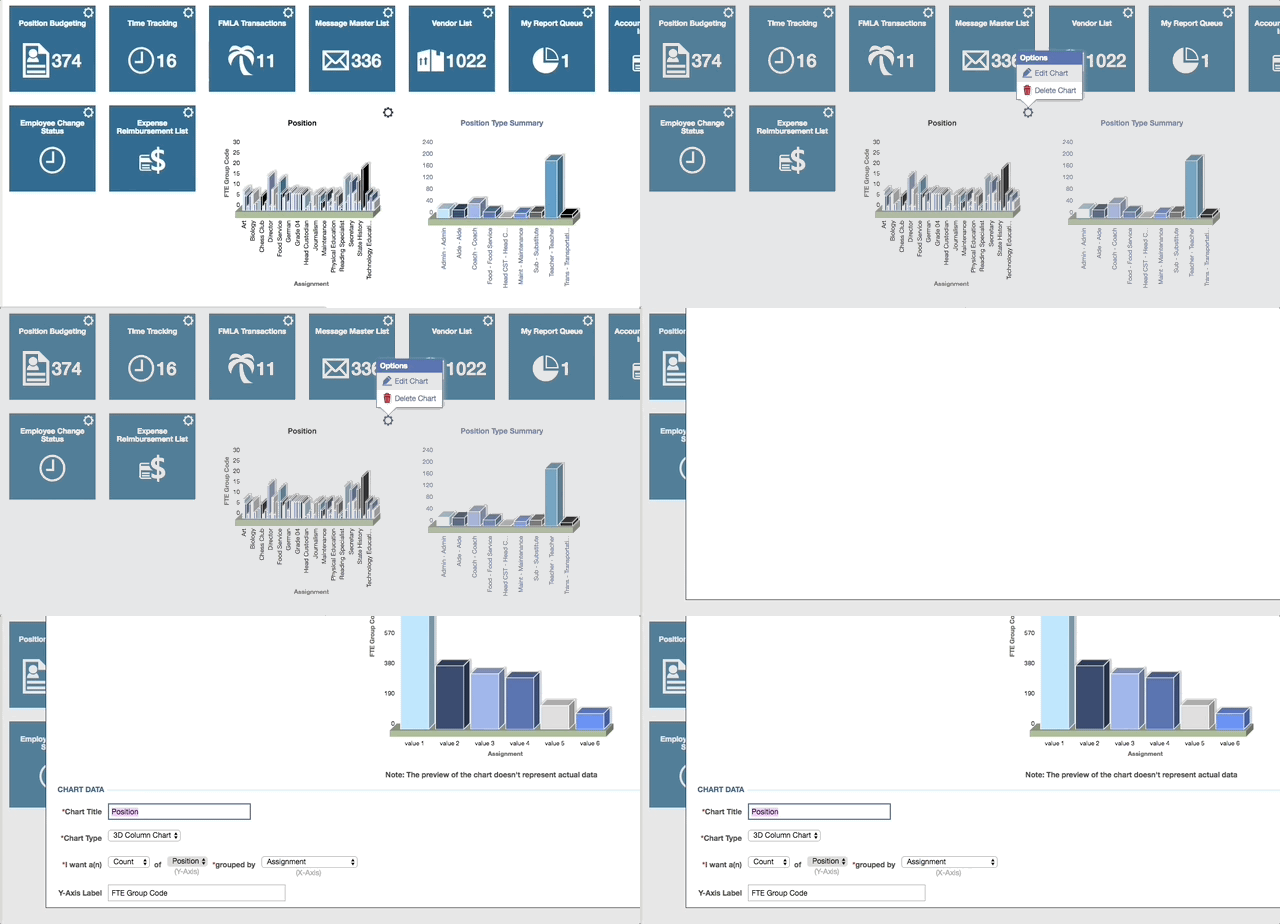
There’s no limit to how many charts or tiles you can add to your dashboard. Tiles and charts can be resized or rearranged by using a simple drag-and-drop function to make everything fit how you want it.
In addition to the colorful tiles, you will also find theme options so you can change the entire color scheme of your dashboard.
When tasks require approval or attention, tiles will display a notification until the tasks are complete. Consider creating a tile for high-volume tasks and positioning it near the top of your dashboard so you never miss an alert.
SMS 2.0: Business
The SMS 2.0 dashboard uses widgets to display information. District administrators decide which widgets will be available for users to choose. Each new employee will see the same set of default dashboard widgets (alternatively, district administrators can log in individually to set up new users’ widgets if they so choose). 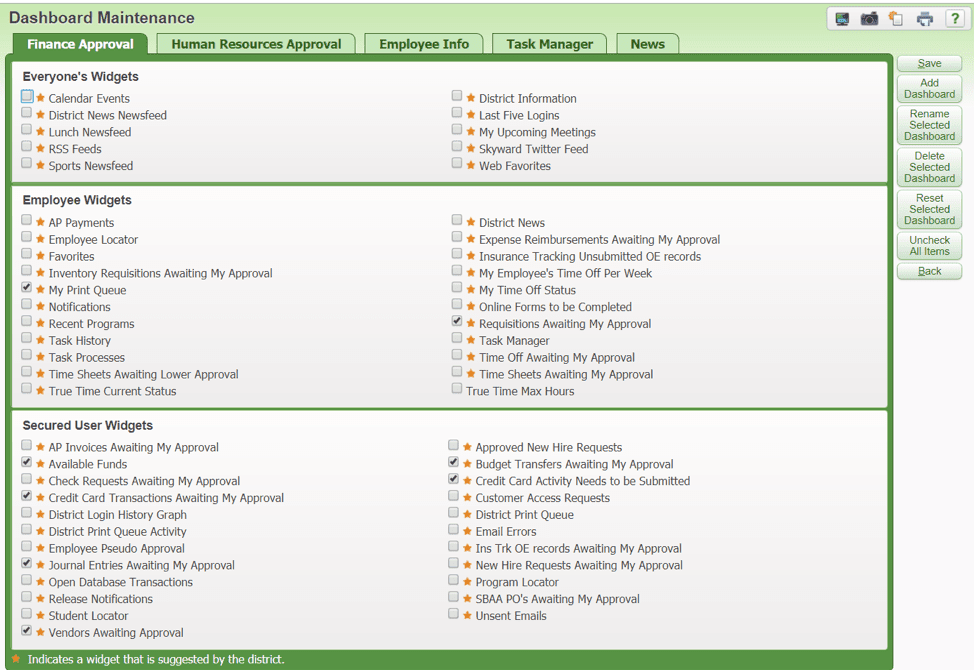
If you’re missing a widget you need, click Select Widgets to visit Dashboard Maintenance, where you can choose from additional widgets made available for your role in your district (administrators will see everyone’s options). Widgets suggested by the district are displayed with a small star. If you’re looking for a little more customizable flair, visit Preferences to choose a color theme for your dashboard.
You can rearrange widgets on the dashboard as desired by dragging and dropping them into place. If you decide you no longer need a widget, hover over the refresh symbol in the upper right corner and the option will appear to remove the widget. Some widgets display alerts when tasks require your attention. The notification will remain active until the issue is resolved.
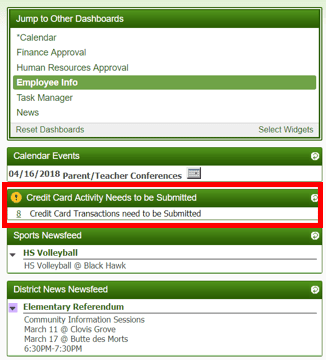
District administrators with Skyward contact access can also add special messages and customize the log in screen Skyport users see before logging in to their dashboards. You can change text colors or add your own school logo to display. If you dabble in HTML, there’s even an option to create stationary or scrolling messages.
Qmlativ: Student
You’ll find colorful tiles on the student side too, with tons of options for users to customize the tiles, charts, and theme. A favorite tile provides a quick link to a different part of the system where you can complete tasks. Use the small gear in the top right corner to make changes to the tile’s appearance. Depending on the user’s role in the district, there are lots of options to pull data directly onto your dashboard. Live tiles include notifications to help prioritize which tasks need your attention first.Administrators and office staff need attendance data at their fingertips. Add Qmlativ charts to represent basic demographics, attendance, and discipline information—but let’s dive deeper. Customize a chart with disciplinary referrals displayed by location to track problem areas and know where to increase security, station aides, or install cameras.
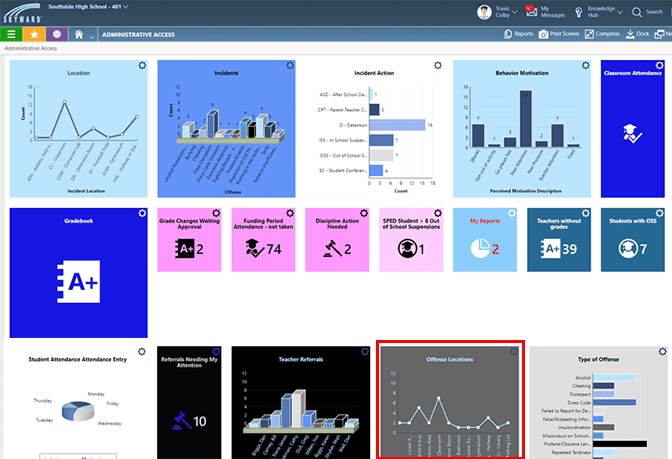
Teacher dashboards focus on gradebooks and attendance for a more specific glimpse of data impacting their classroom day-to-day. Access the teacher dashboards on desktop or mobile to enter grades, notes, and attendance info while away from the classroom. Changes made on a desktop dashboard will flow into your mobile dashboard.
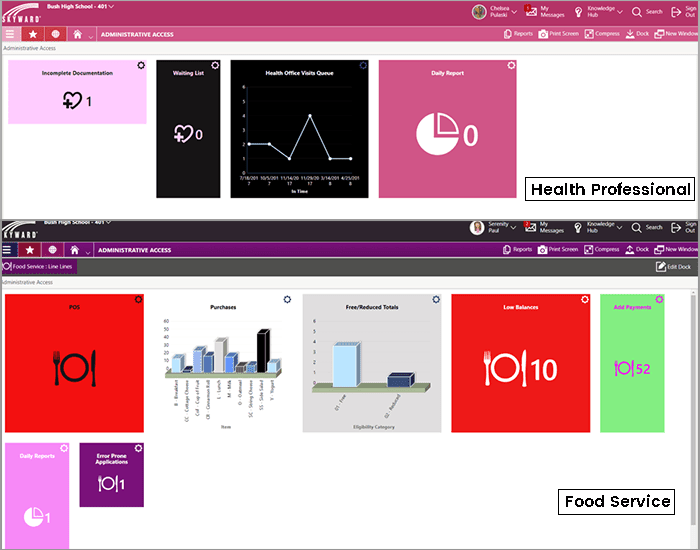
Specialized staff can create extremely specific, useful dashboards tailored to their roles. School nurses can focus on documentation and student appointments. Food service workers can explore point-of-sale data and track items sold. Tiles and charts mean there’s no need to go to multiple screens to run a report (though the option is still there to do so, if you prefer).
SMS 2.0: Student
As with SMS 2.0 Business, administrators can suggest widgets on the dashboard based on users’ roles. One particularly useful widget to explore is the student locator. Search by name (or part of a name) to locate students on campus. Add the Skyward Twitter feed to learn something new in your dashboard every day.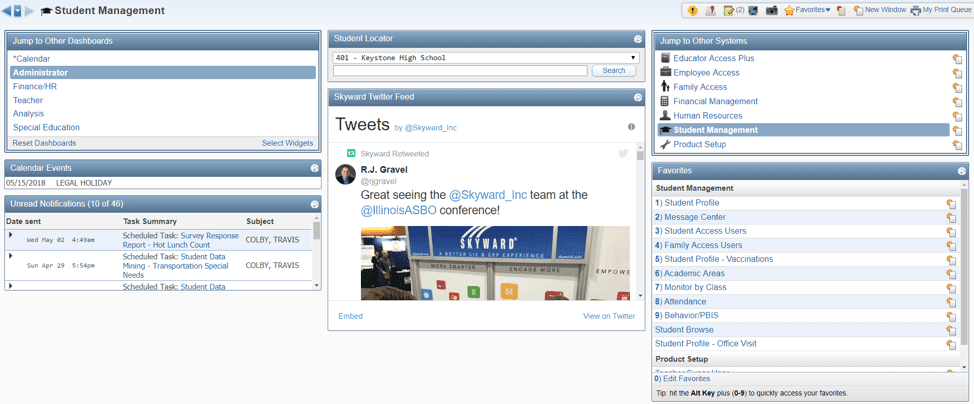
If you’re missing a widget you need, click Select Widgets to visit Dashboard Maintenance, where you can choose from additional widgets made available for your role in your district (administrators will see everyone’s options), including those recommended by the district indicated with a star.
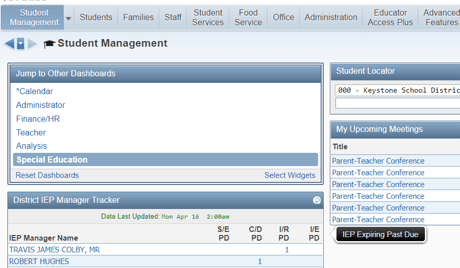
Teachers have quick access to grades and attendance in a single click. They can also see a complete roster at a glance on their dashboards. Special education teachers can see the teachers they work with and have a widget showing IEPs expiring soon.
Use and share these tips with your team to create seamless dashboards for everyone. Fetch necessary data, minimize clicks, and make your dashboard your happy place. Take a moment to tidy up your dashboard today.
Follow-up Resource: Brand Your Login Page
Learn how to make your login page shine with custom logos and more in this Quick Hits video.Thinking about edtech for your district? We'd love to help. Visit skyward.com/get-started to learn more.
|
Erin Werra Blogger, Researcher, and Edvocate |
Erin spent sixteen+ years learning, then launched a professional career delving into the inner workings of practice, data, and edtech in K-12 schools. She is always looking to deliver more insights to help you work smarter every day.

 Get started

